WebPublisher/JavaScript & jQuery
[SVG] stroke-dasharray와 stroke-dashoffset을 활용한 파이 차트 프로그레스바 만들기
amanda
2025. 5. 9. 14:39
HTML
<div class="bow_wrap">
        <div class="item" data-percent="0">
            <figure>
                <svg viewBox="0 0 180 174" xmlns="http://www.w3.org/2000/svg">
                    <path d="M32.0055 168.5C-92.5 -41.5 275.501 -55.7932 146.006 168.5"/>
                </svg>
            </figure>
            <span class="text">0%</span>
        </div>
        <div class="item" data-percent="50">
            <figure>
                <svg viewBox="0 0 180 174" xmlns="http://www.w3.org/2000/svg">
                    <path d="M32.0055 168.5C-92.5 -41.5 275.501 -55.7932 146.006 168.5"/>
                </svg>
            </figure>
            <span class="text">50%</span>
        </div>
        <div class="item" data-percent="100">
            <figure>
                <svg viewBox="0 0 180 174" xmlns="http://www.w3.org/2000/svg">
                    <path d="M32.0055 168.5C-92.5 -41.5 275.501 -55.7932 146.006 168.5"/>
                </svg>
            </figure>
            <span class="text">100%</span>
        </div>
    </div>
CSS
.bow_wrap{display: flex;}
.bow_wrap .item{width: 100%;max-width: 180px;background: url('bow_bg.svg') no-repeat top center / contain;/*aspect-ratio: 180 / 174;*/}
.bow_wrap .item figure{margin: 0;padding: 0;}
.bow_wrap .item path {fill: none;stroke-width: 10;stroke-linecap: round;}
.bow_wrap .item:nth-child(1) path{stroke: red;}
.bow_wrap .item:nth-child(2) path{stroke: blue;}
.bow_wrap .item:nth-child(3) path{stroke: violet;}
JavaScript
document.querySelectorAll('.item').forEach(item => {
    const percent = parseFloat(item.dataset.percent) / 100;
    const path = item.querySelector('path');
    const length = path.getTotalLength();

    path.style.strokeDasharray = length;
    path.style.strokeDashoffset = length * (1 - percent);
});
getTotalLength()로 path의 총 길이를 구해준뒤
path에 stroke-dasharray 속성으로 총 길이를 넣어준다
프로그레스바의 퍼센트 비율은 stroke-dashoffset 속성에 넣어준다
완성된 모습
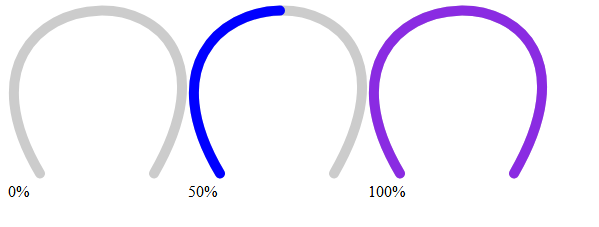
반원보다 살짝 더 채워진 모양으로 svg 만들고자 했으나 피그마 path로 곡선 만드는 것이 너무 어려웠다
대강 비슷한 모양으로 만들어봤는데 성공 !